You deployed OpenClaw. You connected your channels. You configured your agents. And then you opened the dashboard for the first time.
This is what you saw:
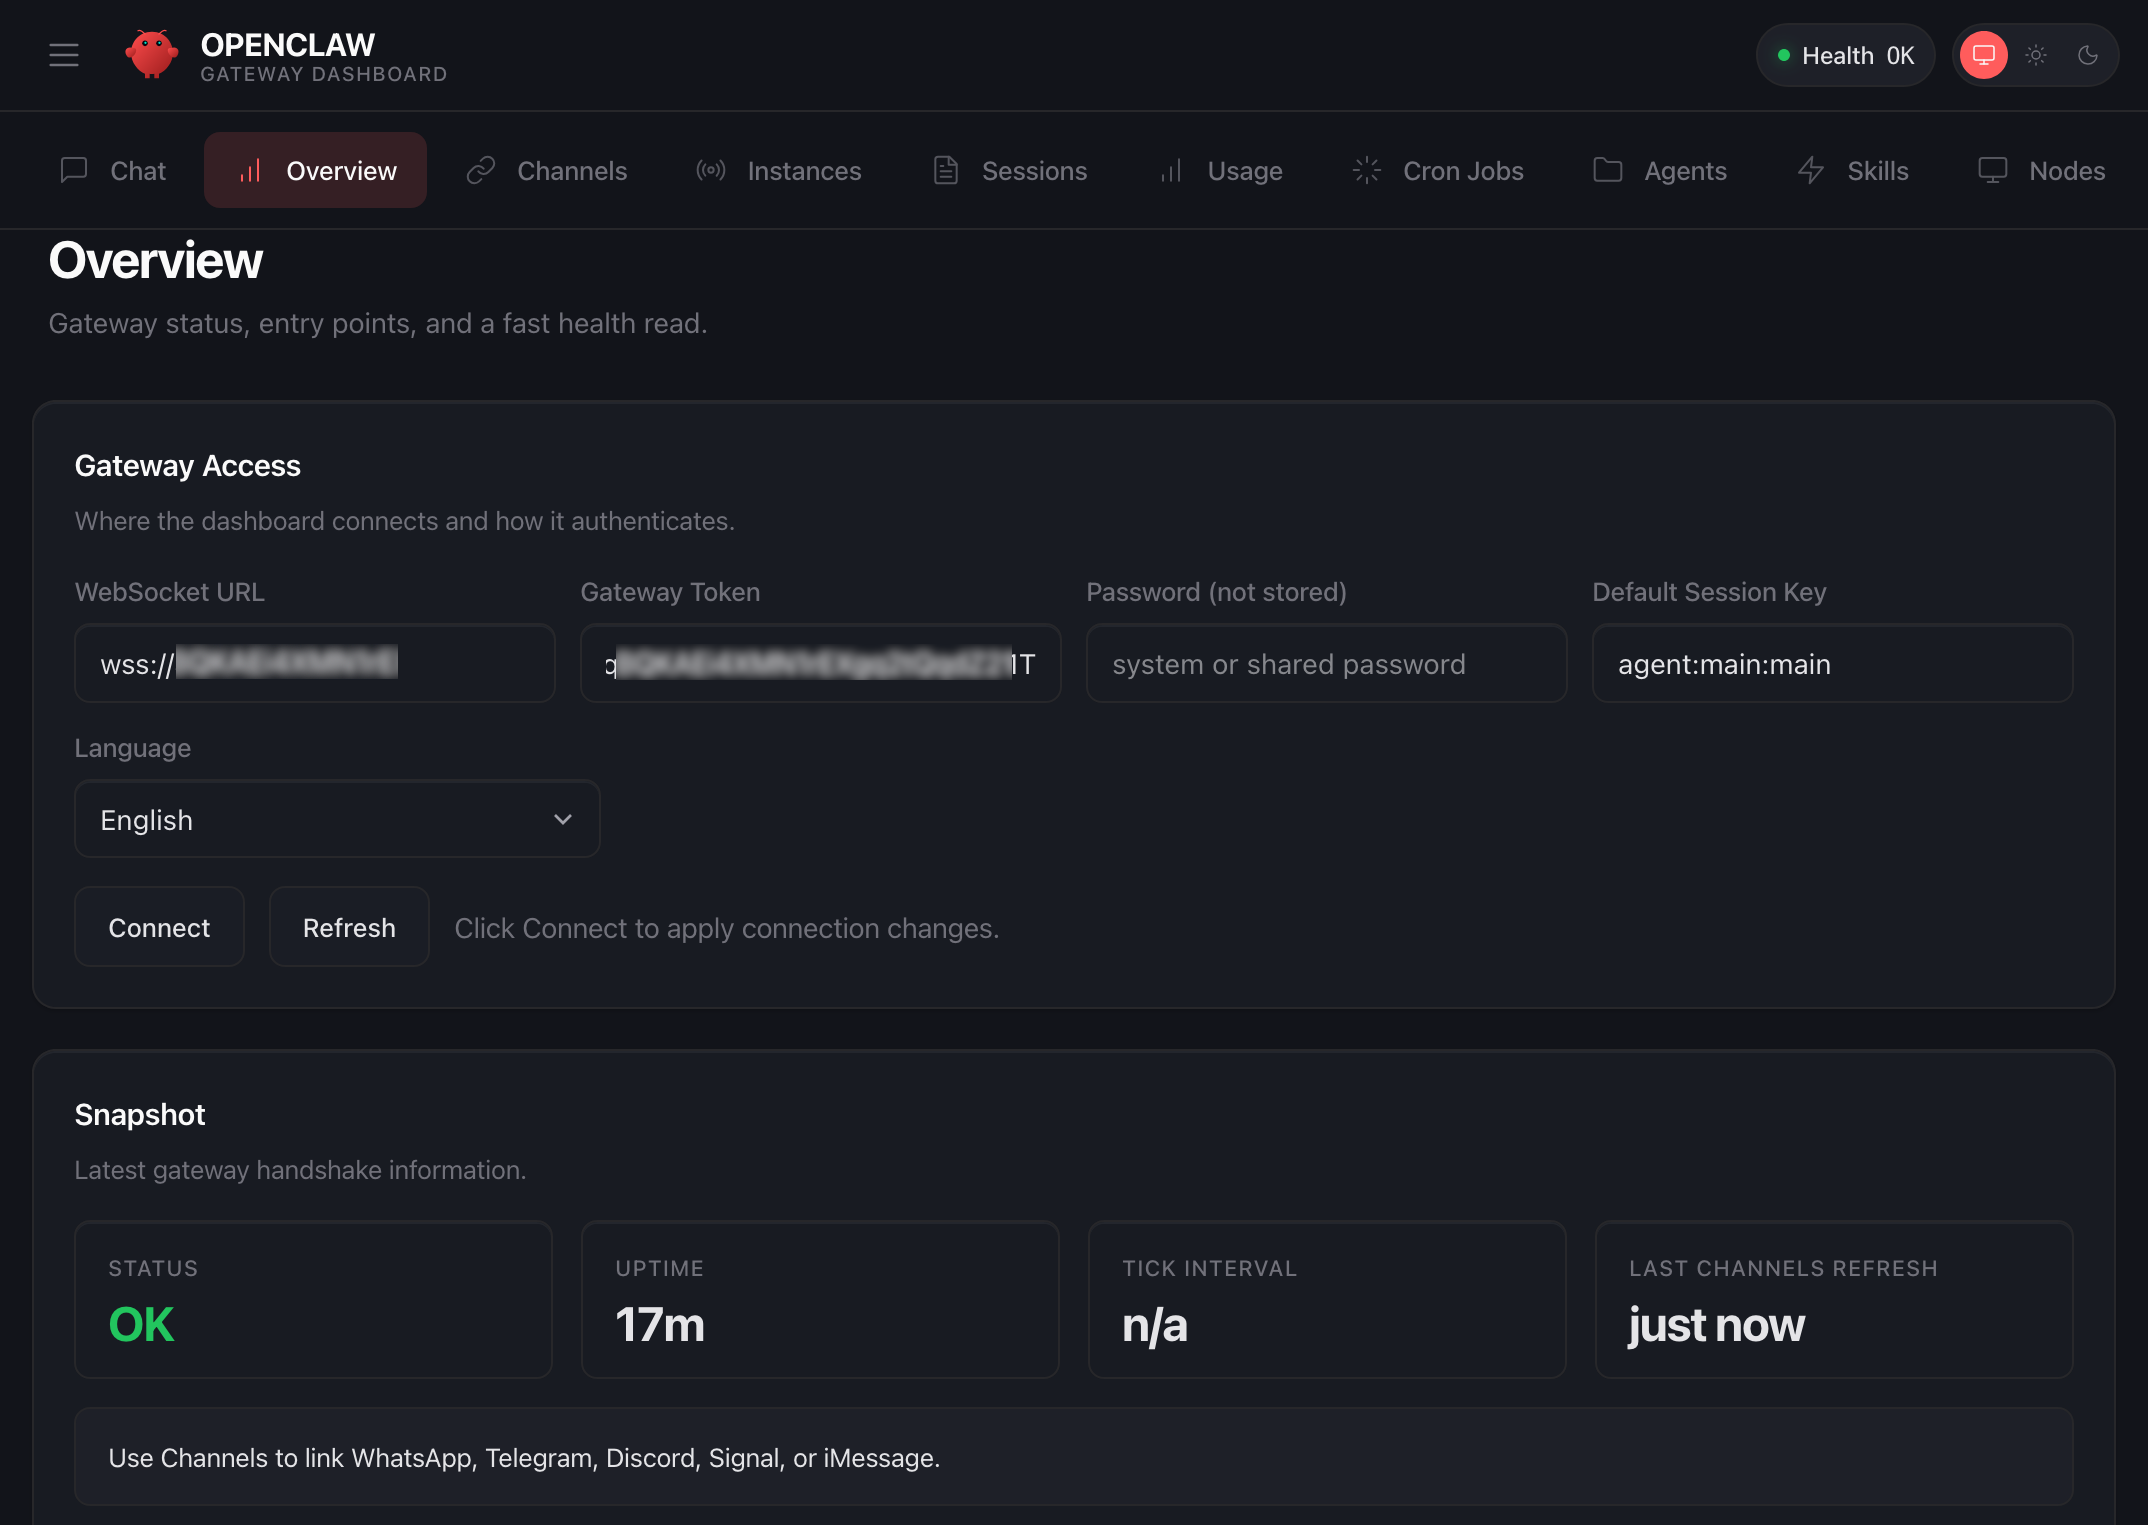
The default OpenClaw Gateway Dashboard. Health status, a websocket URL, an uptime counter. That is it.
A health check that says "OK." A websocket URL you will never manually type. An uptime counter. A language selector. Four snapshot metrics. And a row of tabs that lead to raw data tables with no context, no hierarchy, and no operational intelligence.
This is not a dashboard. This is a configuration page that shipped as default because the open-source project needed something to show after install. It was never designed to run a business. It was designed to confirm the software is working.
Eight percent. You are running an AI workforce that handles your leads, your transactions, your client communications, your scheduling, and your operations. And you can see eight percent of what it is doing. The other ninety-two percent? You are blind to it. Things are happening inside your system right now that you have no visibility into. Errors are occurring that you will not discover for days. Agents are making decisions that you cannot audit. Costs are accruing that you cannot attribute.
You would never run a company with no accounting software, no project management, and no performance reviews. But that is exactly what you are doing with your AI system right now.
92%
Invisible
of system activity hidden from you
~8
Undetected errors
per month on average
4.2h
Mean time to fix
issues discovered too late
$0
Cost attribution
no per-agent spend tracking
These numbers are from real deployments. Not hypothetical scenarios. Businesses running multi-agent OpenClaw systems worth thousands of dollars per month in compute and operational value, with almost no visibility into what is actually happening inside the system. Errors compound. Costs drift. Performance degrades. And nobody notices until something breaks that is visible to a client.
This Is What Mission Control Looks Like
Now look at this:
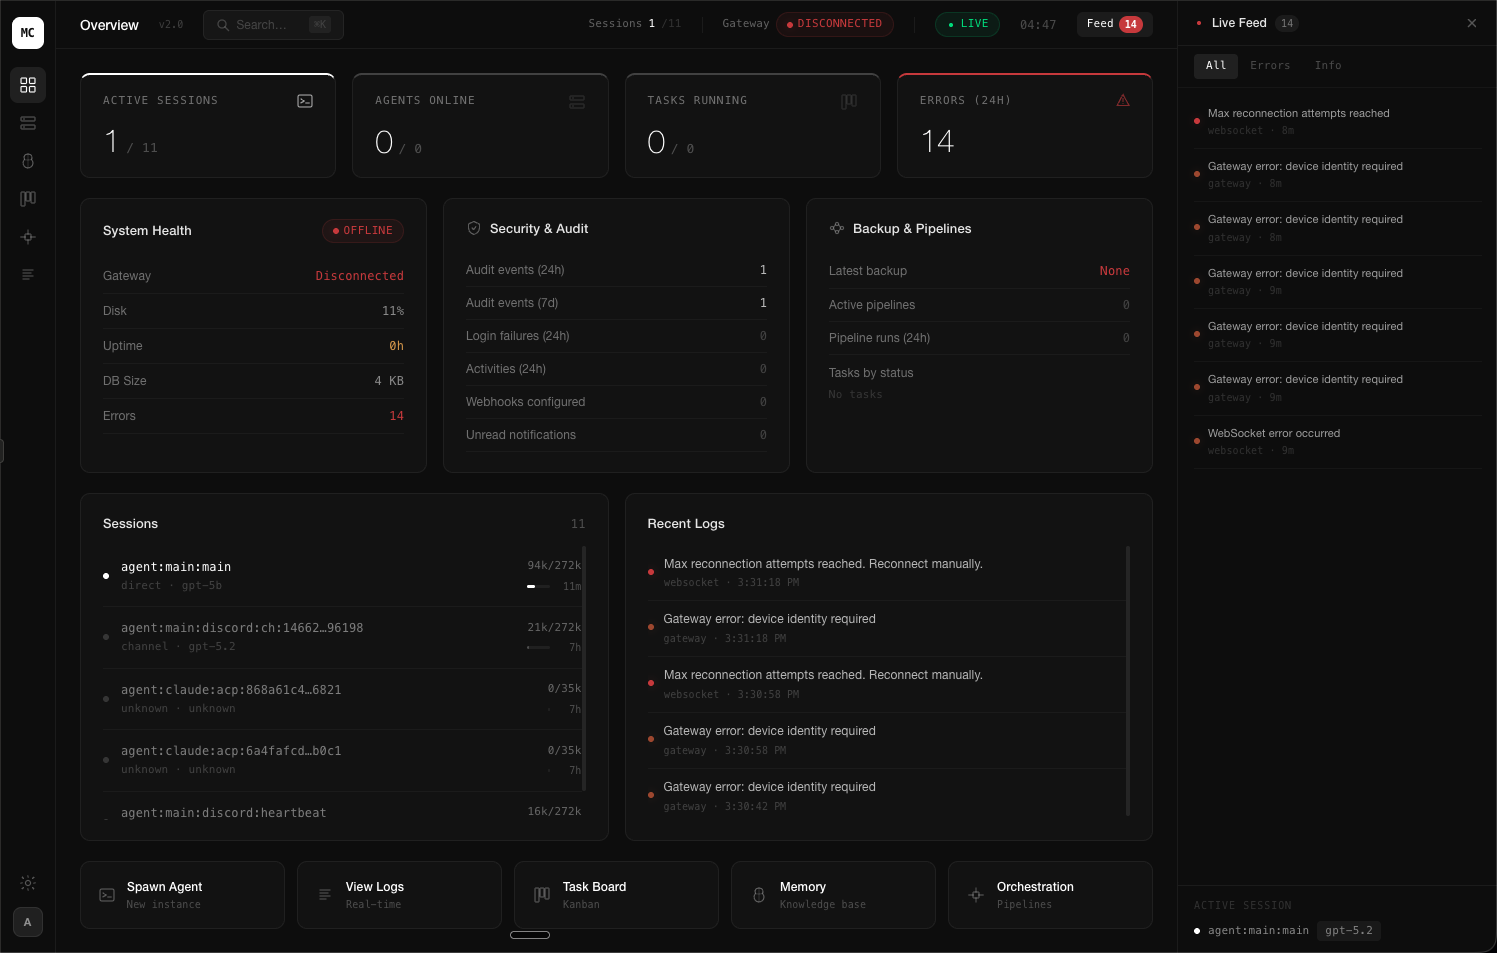
A custom-built Mission Control dashboard. Every metric, every agent, every error, every session. Real-time. One screen.
This is the same OpenClaw system. Same gateway. Same agents. Same underlying infrastructure. The only difference is what you built on top of it. And that difference is the difference between operating blind and operating with total control.
Let me walk you through exactly what you are looking at.
Top Bar: Operational Pulse
One active conversation out of eleven total. You know exactly which agent is talking to whom, right now.
Immediate visibility into connection status. No guessing. No checking logs. Red means fix it.
Real-time data streaming. Every number on this screen updates the moment something changes.
Fourteen events in the queue. Click to expand. Filter by type. Every single thing the system did is logged.
That is just the top bar. Four pieces of information that the default dashboard cannot show you at all. And we have not even looked at the panels yet.
1/11
Active Sessions
Live agent conversations
0/0
Agents Online
Spawned vs. configured
0/0
Tasks Running
Background pipelines
14
Errors (24h)
Needs attention
Four numbers that tell you more about your system health in one glance than the default dashboard tells you in ten minutes of clicking through tabs. Active sessions. Agent availability. Task execution. Error volume. This is the minimum viable pulse check. If any of these numbers look wrong, you know instantly.
The Six Panels That Run Your Business
A properly built Mission Control is not a collection of charts. It is a decision engine. Every panel exists because there is an operational question it answers instantly. Here are the six that matter.
Panel 1: System Health
The question this answers: "Is my system running properly right now?"
Without this panel, you discover disk is full when agents stop responding. You discover memory leaks when sessions crash. You discover uptime issues when a client messages you asking why nothing is working. With this panel, you see the problem forming before it becomes a problem.
Panel 2: Sessions
The question this answers: "What is every agent doing right now, and how much capacity is being used?"
Every session. Token usage. Model assignment. Active duration. Context window fill rate. You can see which agents are approaching their context limit. You can see which sessions have been running longest. You can see exactly where your compute budget is going.
Panel 3: Security and Audit
The question this answers: "Has anything unauthorized happened in my system?"
Your AI system has access to your business data, your client communications, your financial records. Without an audit panel, you have zero visibility into who accessed what, when, and whether any boundaries were tested. This is not optional if you handle client data. It is a liability.
Critical Gap
Most OpenClaw users have never once reviewed their audit logs. Their agents have been running for weeks or months with full access to business data and no oversight mechanism. If a data handling issue occurred, they would have no way to trace it, no way to prove compliance, and no way to identify what was affected.
Panel 4: Live Feed
The question this answers: "What just happened, and should I care?"
This is your system thinking. Every decision, every action, every event. Filterable by type, severity, and agent. On the default dashboard, this information is buried in raw log files that you would need SSH access to read.
Custom Mission Control
Want a Dashboard Built for Your Business?
Every Mission Control we build is designed around your specific operations, agents, and KPIs. No templates. Architecture-first.
Now Watch It Run
Screenshots are one thing. Watching it live is another. This is a recording of agents operating in real-time inside a custom Mission Control build. Multiple agents. Multiple sessions. Tasks executing, logs streaming, metrics updating. All autonomous. All visible.
Live recording: Agents executing tasks in real-time through Mission Control
This is what it looks like when you can actually see your AI system working. Not a chat window. Not a log file. A real-time operational command center where every agent, every session, every transaction, and every error is visible the moment it happens.
The business owners running setups like this do not check on their systems. Their systems check in with them. The dashboard surfaces what matters and suppresses what does not. You open it once in the morning, scan the metrics, and get on with scaling your business.
Right Now, Inside Your OpenClaw
While you are reading this article, your agents are running. Transactions are being processed. Sessions are consuming tokens. Errors may be occurring. Context windows are filling up. Heartbeats are firing. And you have no idea which of these statements is true and which is not. Because you cannot see any of it.
Every single one of these events is visible on a properly built Mission Control. On the default dashboard, none of them are.
The Command Bar: Operations at Your Fingertips
At the bottom of every Mission Control build is the command bar. Five actions that cover ninety percent of what you would ever need to do manually:
Spawn Agent
Launch a new agent instance on demand
View Logs
Real-time streaming system logs
Task Board
Visual pipeline management
Memory
Knowledge base explorer
Orchestration
Agent pipeline builder
Spawn Agent lets you deploy a new agent instance without touching a config file. View Logs streams every event in real-time with severity filtering. Task Board gives you Kanban-style pipeline management for multi-step workflows. Memory opens the knowledge base explorer so you can see what your agents remember. And Orchestration is where you wire agents together into execution pipelines.
On the default dashboard, every single one of these actions requires SSH access, command-line knowledge, and manual config file editing. On Mission Control, it is one click.
Key Insight
The average time to spawn a new agent on the default setup: 12 minutes of config editing, testing, and restarting. On a properly built Mission Control: 8 seconds. Over a year of operations, that difference compounds into hundreds of hours saved.
What Makes a Mission Control Build Actually Work
You cannot just throw panels on a screen and call it a dashboard. Every Mission Control build we deploy follows a specific architectural methodology that determines what gets shown, where it sits, and how it connects to the underlying system. Here is the framework.
Five layers. Each one depends on the layer below it. Get the transport wrong and your dashboard disconnects randomly. Get the authentication wrong and your dashboard becomes a security risk. Get the data transformation wrong and your metrics are misleading. Get the state management wrong and your UI shows stale data while you make decisions based on information that is thirty seconds old. Get the presentation wrong and the whole thing is unusable on mobile.
This is not a weekend project. This is a full-stack engineering challenge that requires deep understanding of the OpenClaw gateway protocol, the WebSocket wire format, the session lifecycle, the agent state machine, and the security model. Each layer has its own set of failure modes that you discover only after deploying to production and watching it break.
Your Morning With vs. Without Mission Control
Without Mission Control
Open laptop. Wonder if anything ran overnight.
SSH into server. Check logs manually. Scroll through walls of text.
Notice an error from 3 AM. Not sure how many leads it affected.
Open Discord. Check each channel. Scroll to see what agents did.
Finally confident nothing is broken. 75 minutes lost. Start actual work.
With Mission Control
Open Mission Control. All green. 47 tasks completed overnight.
Check live feed. Lead sourcer ran at 3 AM. 50 new leads. Revenue logged.
Errors panel: zero. Uptime: 847 hours. All agents healthy.
Close dashboard. Start scaling your business. Four minutes total.
Seventy-one minutes every single morning. That is over 430 hours per year spent babysitting a system instead of growing a business.
Custom Mission Control
Want a Dashboard Built for Your Business?
Every Mission Control we build is designed around your specific operations, agents, and KPIs. No templates. Architecture-first.
The Security Layer You Are Probably Missing
Let me ask a question that should make you uncomfortable: Who else can access your OpenClaw dashboard right now?
The default dashboard authenticates with a single gateway token. If someone obtains that token, they have full access to every agent, every session, every piece of data your system processes. There is no role-based access control. There is no device identity validation. There is no audit trail of who logged in and when.
A proper Mission Control build implements device-based authentication with pairing approval, role-based access control so team members see only what they should, session scoping so agents are isolated from each other, and comprehensive audit logging that records every access event. This is not enterprise overkill. This is basic operational hygiene for a system that processes business data.
Critical Gap
If you are using OpenClaw for client work and handling their data through your agents, you have a professional responsibility to know who has access to that system. The default dashboard gives you no mechanism to verify this. A single leaked gateway token compromises everything.
"I Already Built My Own Dashboard"
Good. Then answer these questions honestly:
Does it reconnect automatically when the WebSocket drops without losing events?
Does it show you the exact token usage per agent per session in real-time?
Can you spawn a new agent from the UI without editing a config file?
Does it have role-based access control so your team cannot see sessions they should not?
Does it reconcile state after a network interruption so every metric is accurate?
Does it track your error rate over time and alert you to patterns before they cause failures?
Does it display agent memory usage, context window fill rates, and pruning events?
Can you audit who accessed the dashboard, when, and what they viewed?
Does it handle idempotency keys for side-effecting gateway API calls?
Does it validate every inbound WebSocket frame against the gateway JSON schema?
Does it work on mobile?
If you answered "no" to more than two of these, your dashboard is a liability disguised as a tool. It is showing you information that may not be accurate. It is missing events that could be critical. And it is giving you a false sense of control over a system that you are actually flying blind on.
Critical Gap
The most dangerous dashboard is one that looks correct but is not. You make decisions based on what you see. If what you see is stale, incomplete, or improperly synchronized, every decision you make from that point forward is based on wrong information. Most self-built dashboards fail silently. They do not crash. They just show you numbers from 45 seconds ago while you think you are looking at real-time data.
Building a dashboard that connects and displays data is a weekend project. Building a dashboard that you can actually trust to run your business is an engineering challenge that requires deep knowledge of the gateway protocol, the WebSocket lifecycle, state management under unreliable networks, and the specific failure modes of every component in the stack. These are not the same skill set. And conflating them is how businesses end up with dashboards that give them confidence without accuracy.
The Wiring Nobody Talks About
A beautiful dashboard with wrong data is worse than no dashboard at all. The most critical part of any Mission Control build is not the UI. It is the wiring. How the dashboard connects to the gateway. How events are parsed. How state is managed. How errors propagate. How reconnection works when the websocket drops.
Fourteen steps in a single connection lifecycle. And this is the simplified version. The actual implementation handles challenge-response authentication, idempotency key generation for side-effecting methods, state version reconciliation after reconnects, event deduplication, and frame-level JSON schema validation. Every one of these must work flawlessly, or your dashboard shows you wrong information. And wrong information is more dangerous than no information.
This is where most people who attempt to build their own dashboard fail. They get the UI working in a weekend. Then they spend three months debugging reconnection edge cases, state synchronization bugs, and missed events that cause metrics to drift. The dashboard looks right. The numbers are wrong. And they make decisions based on stale data without knowing it.
What This Article Did Not Tell You
You now understand why a custom Mission Control matters. You know what panels should exist. You know the architectural layers. You know the security implications. But there is a significant gap between understanding the theory and building the system. Here is everything you still cannot do after reading this article:
How to establish and maintain a WebSocket connection to the OpenClaw gateway with proper authentication handshake
The exact frame format for subscribing to real-time events and parsing the typed response payloads
How to implement reconnection logic that handles state delta synchronization without duplicating or dropping events
The data transformation pipeline that converts raw gateway events into the aggregated metrics displayed in each panel
How to implement RBAC scoping that restricts dashboard views based on device identity and agent permissions
The caching strategy that keeps the dashboard responsive without showing stale data after network interruptions
How to wire the command bar actions to the gateway API with proper idempotency keys and error handling
The deployment architecture that exposes the dashboard securely without opening your gateway to the public internet
How to build alert thresholds that notify you before system issues become operational failures
The testing methodology for verifying that every metric on screen is accurate under high-concurrency agent loads
Knowing what to build and knowing how to build it are completely different skills. This article gave you the first one. The second one takes engineering.
The Math on Visibility
Annual Impact: Default Dashboard vs. Mission Control
Four hundred and six hours per year. At any reasonable hourly rate, that is tens of thousands of dollars in recovered productivity. And that does not account for the cost of errors you never caught, the leads you lost to system downtime you did not see, or the security incidents you could not trace.
A properly built Mission Control is not a luxury. It is the cheapest operational investment you can make relative to the cost of not having it.
What Our Clients See When They Open Their Dashboards
Every Mission Control build is different because every business is different. But the principle is the same: total visibility, zero guesswork, instant decisions.
E-Commerce
Revenue tracker, Ad spend analyzer, Inventory alerts, Order pipeline, Return rate monitor
Reduced operational overhead by 73%. Owner checks dashboard once at 8 AM. Business runs itself.
Real Estate
Lead pipeline, Deal stage tracker, Comp analysis feed, Client communication log, Market alerts
Went from 12 deals/month to 28 without adding team members. Every lead visible from first touch to close.
Agency
Client health scores, Deliverable tracker, Team utilization, Revenue per client, Churn risk alerts
Scaled from 8 to 22 clients with the same team. Client satisfaction increased because nothing falls through cracks.
These are not template dashboards with your logo slapped on. Every panel was designed around the specific workflows, KPIs, and decision points of that business. The agency owner does not see inventory alerts. The e-commerce operator does not see deal stages. Each Mission Control is built to answer the exact questions that matter for that operation.
You built the system. You configured the agents. You are paying for the compute. The only thing missing is the ability to actually see what you are paying for.
Your AI System Deserves Better Than a Health Check Page
Every Mission Control we build starts with a 30-minute architecture call where we map your agents, your workflows, and your KPIs. Then we design a dashboard around exactly how you operate. Not a template. Not a fork of the default UI. A purpose-built command center for your business.
Average build time: 4 days. Average ROI timeline: the first week.